Perfecting cycling posture

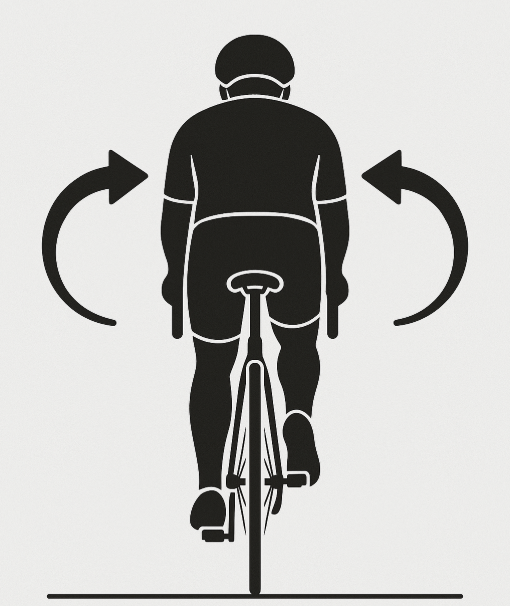
One of the problems I have with cycling is that sometimes I rock a bit from side to side. I know having a good bike fit helps eliminate this issue entirely. A proper bike fit resolves many problems. And I did get one. But I still believe there is some power being lost due to the lateral movements. I'm not sure how significant it is or whether a certain amount of side-to-side motion is acceptable.
Academic Research
A quick dive into studies on road cyclists shows that a bit of rocking, especially during sprinting, is not only common but beneficial. This movement, particularly when cyclists are out of the saddle, allows them to leverage gravity with each pedal stroke to generate more power.
However, for endurance riders, the story is different. Efficiency becomes the priority, and excessive lateral movement can result in power loss over extended periods. Through some digging, I learned about three types of movement relevant to this issue:
- Obliquity Angle: This refers to the rotation of the hips along the X-axis – essentially the side-to-side rocking.
- Internal and External Rotation: This happens along the Y-axis and can reveal asymmetries in leg strength or flexibility.
- Tilt Angle: This shows posture and can indicate fatigue in the core, especially over longer rides.
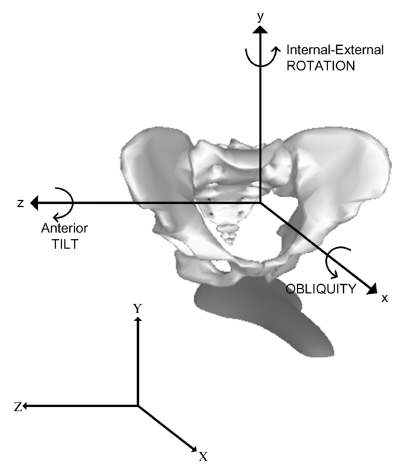
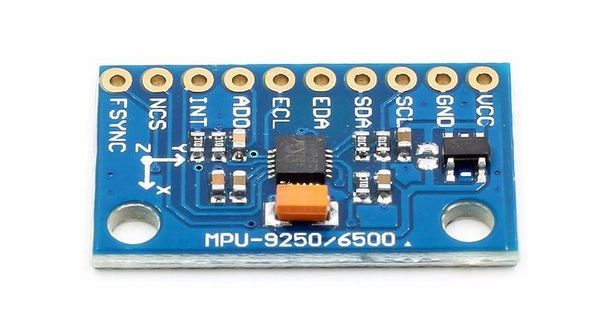
To quantify this movement, a camera would be ideal for indoor settings. But for outdoor and longer rides, an Inertial Measurement Unit (IMU) is better suited. IMUs combine accelerometers, gyroscopes, and magnetometers to estimate orientation. I opted for an IMU sensor from MbientLab (MMS), preferring a reliable pre-built unit over making one from scratch, as IMUs are notoriously noisy.
Sensor Placement
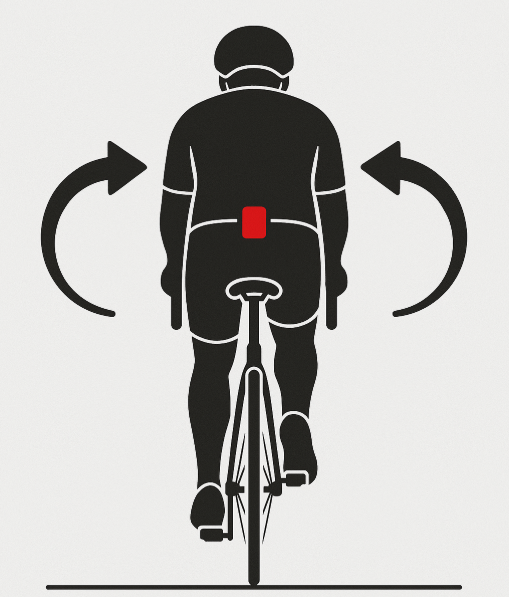
Choosing where to place the sensor was critical. Ideally, multiple sensors on the back would give the best results, not just in terms of accuracy but also by providing a comprehensive understanding of body dynamics. With more sensors, it's possible to evaluate various placements and determine which one offers the most reliable insights for the specific use-case. Moreover, additional sensors help capture information that a single sensor might miss, such as localized asymmetries or subtle posture shifts. However, with limited units and the complexity of syncing them, I settled on placing one at the center of the lower back – a position that should offer decent insights for this use case.
Data Acquisition
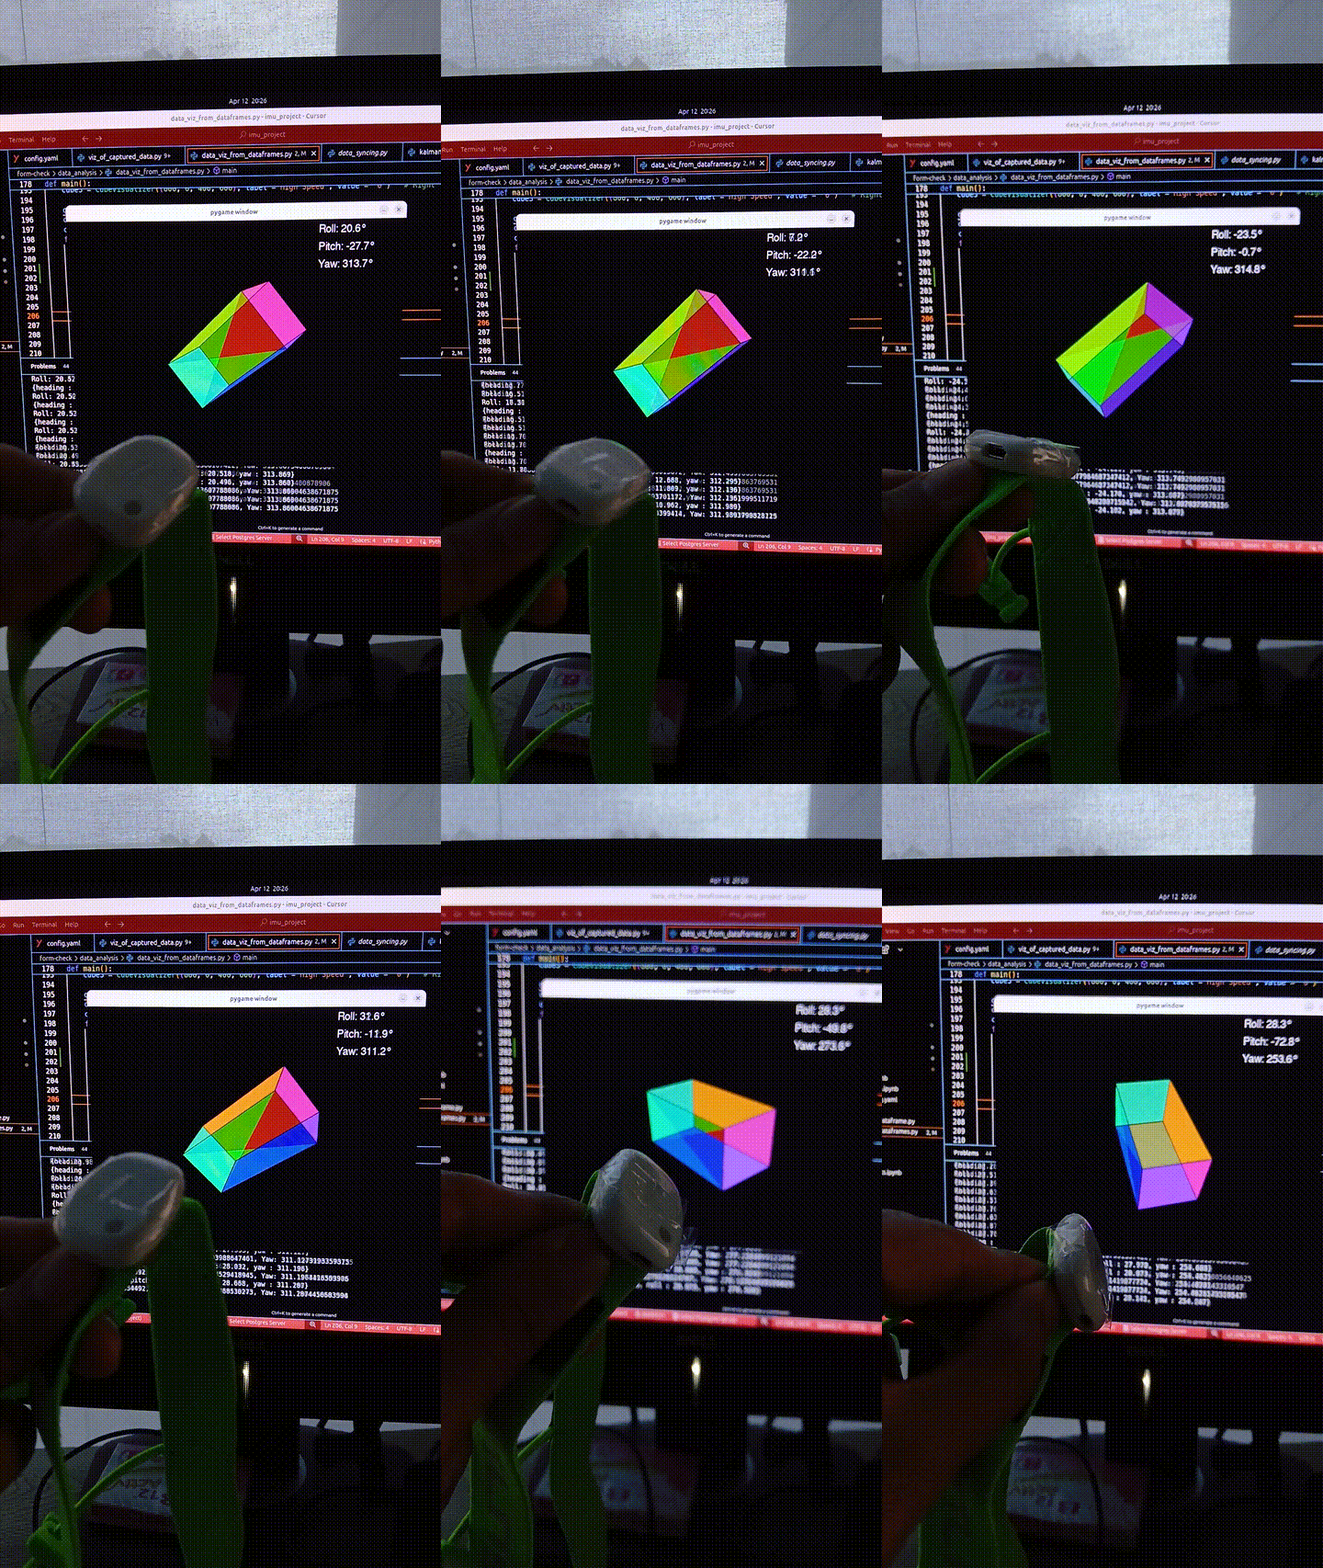
Getting started with the MMS sensor took some time. MbientLab's API isn't the most intuitive but is well-structured. I like how everything is attaching to various events on the sensors and having callbacks in place for custom procedures. The code could be executed only when there is a motion detected or procedures for performing basic averaging on some signals. After some debugging, I managed to stream data and generate basic visualization.
For the initial controlled tests, I collected data indoors while training. The sensor logged data during sessions at different speeds (slow, medium, and fast) to the on-board memory, which was later downloaded for analysis. One thing that was frustrating was the amount of time it took to download the data. There was a significant wait time(because the download time took double the logging time) between the runs. This was one of the deciding points to work more on direct streaming of the data.
Looking at the accelerometer data from various runs, showed some promise. There was some visual difference between medium and high speed runs. The higher peaks at higher speeds does show more hip movement(lateral movement).
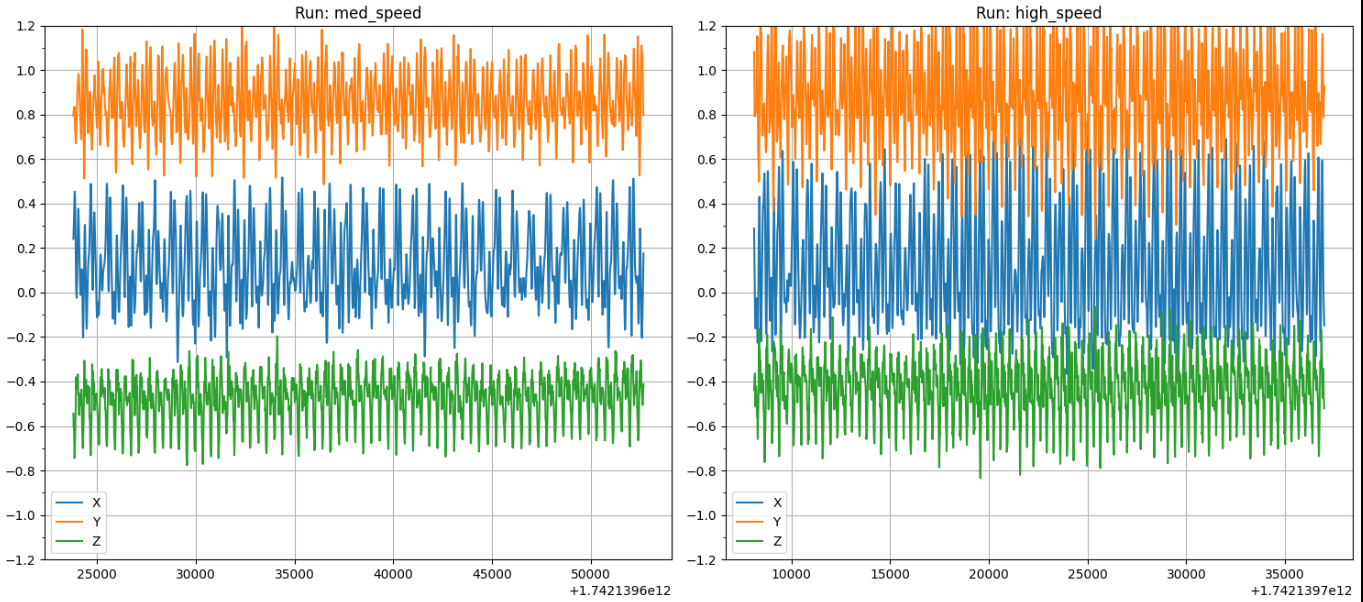
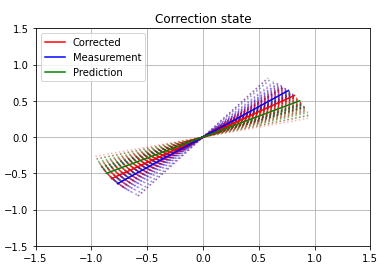
To make this data more digestible, I computed orientation using a Kalman filter and analyzed the Interquartile range (IQR) for each axis. The roll (X-axis) from the IMU gave a reasonable measure of lateral movement. This still needs refining, but it's a good start.
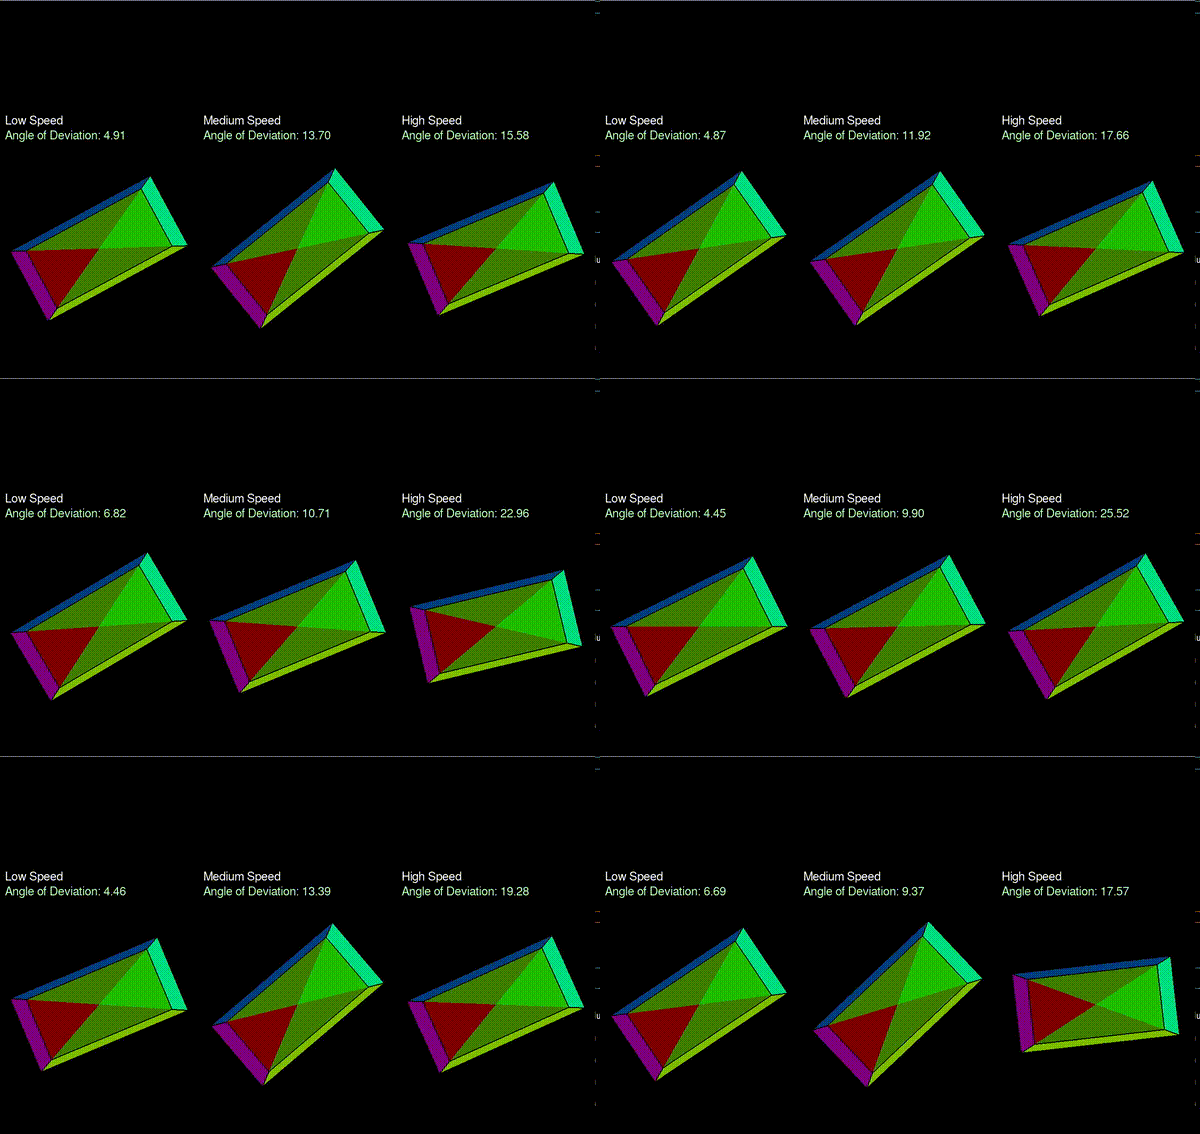
This experiment gave me some confidence to invest more time to build a proper data acquisition system. Ideally, data from outdoor conditions is useful to perfect the filtering method and to identify key metrics for long term usage.
Putting it all together
It was important to build an app for data acquisition since the data from outdoor biking is quite useful. There was the Metabase app from Mbientlab which had the logging functionality. However, it did lack other things like uploading the data to the cloud. I took the decision of building an app(also, a fun learning experience) considering that it would be a good foundation as I could keep adding features to it. For now, it is a simple data acquisition app but it has provisions to show a metric and provide some feedback to the cyclists. I took the route of streaming the data directly from sensor's Bluetooth since logging the data and then downloading takes long time.
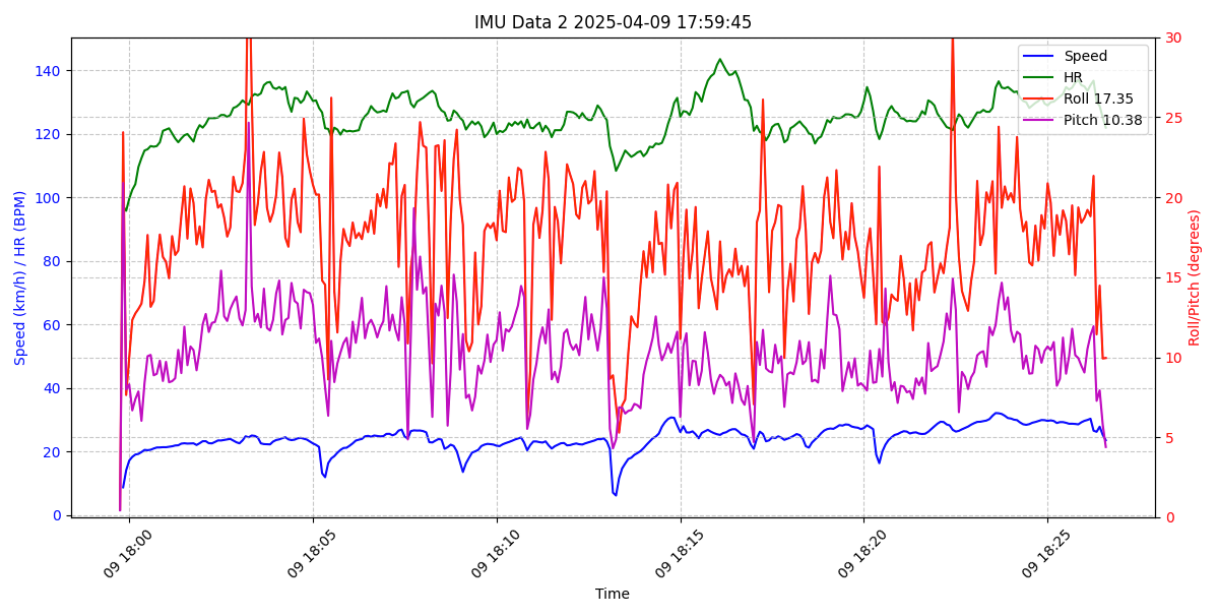
The current data acquisition is as follows. Data from the IMU sensor is logged to the phone during the bike ride. This gets synced with the AWS s3 bucket. A script on my computer pulls both the IMU data and Garmin activity data. It merges both the data points based on the timestamps and creates some basic visualizations.
Problems:
The first Problem is about not having concrete data to measure the IMU data against. The Garmin data does provide signals like speed and heart-rate. However an ideal signal would be power. Signals like speed and heart-rate depend on some external factors as well. The correlation between Garmin signals and IMU data might be difficult to idenitfy. The next few weeks will provide some insights into this.
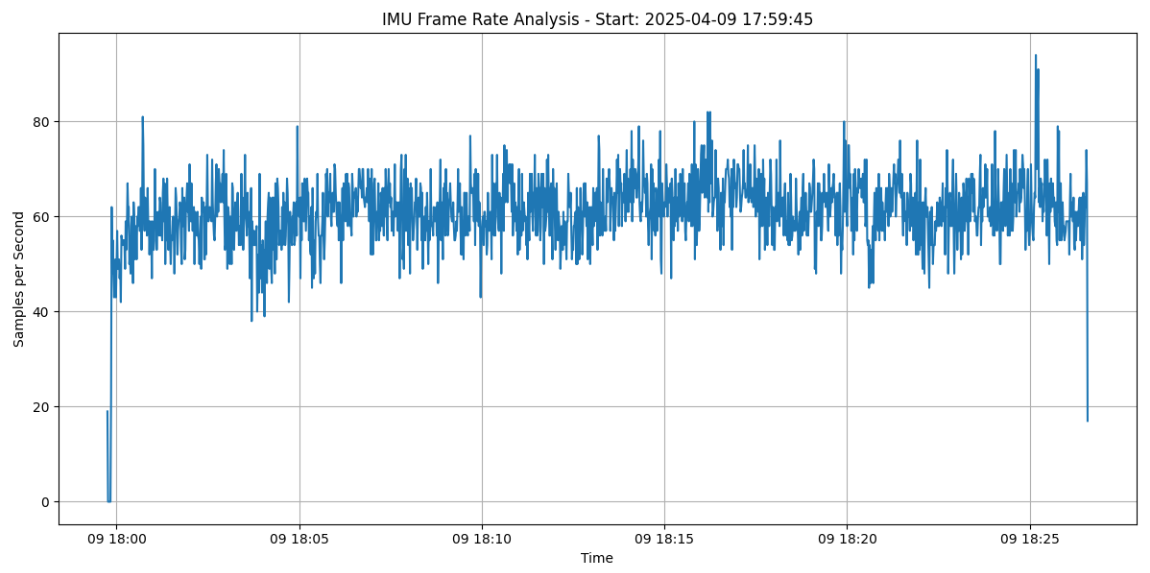
The second problem was the Bluetooth streaming. I went with this method since it was fast. However, during the ride, I did see a drop in the amount of samples collected per second. Normally the configuration is at 100 samples per second. Checking the data later, only 60-65 samples per second were collected. It is currently hard to quantify how significant this loss in samples is. The other approach is to log the data directly to the sensor and then download it later after the ride. However this takes far too long. The plan currently is to go ahead with the current data acquisition system. If it becomes hard to find data patterns, I guess then it makes sense to put more time in the other approach.
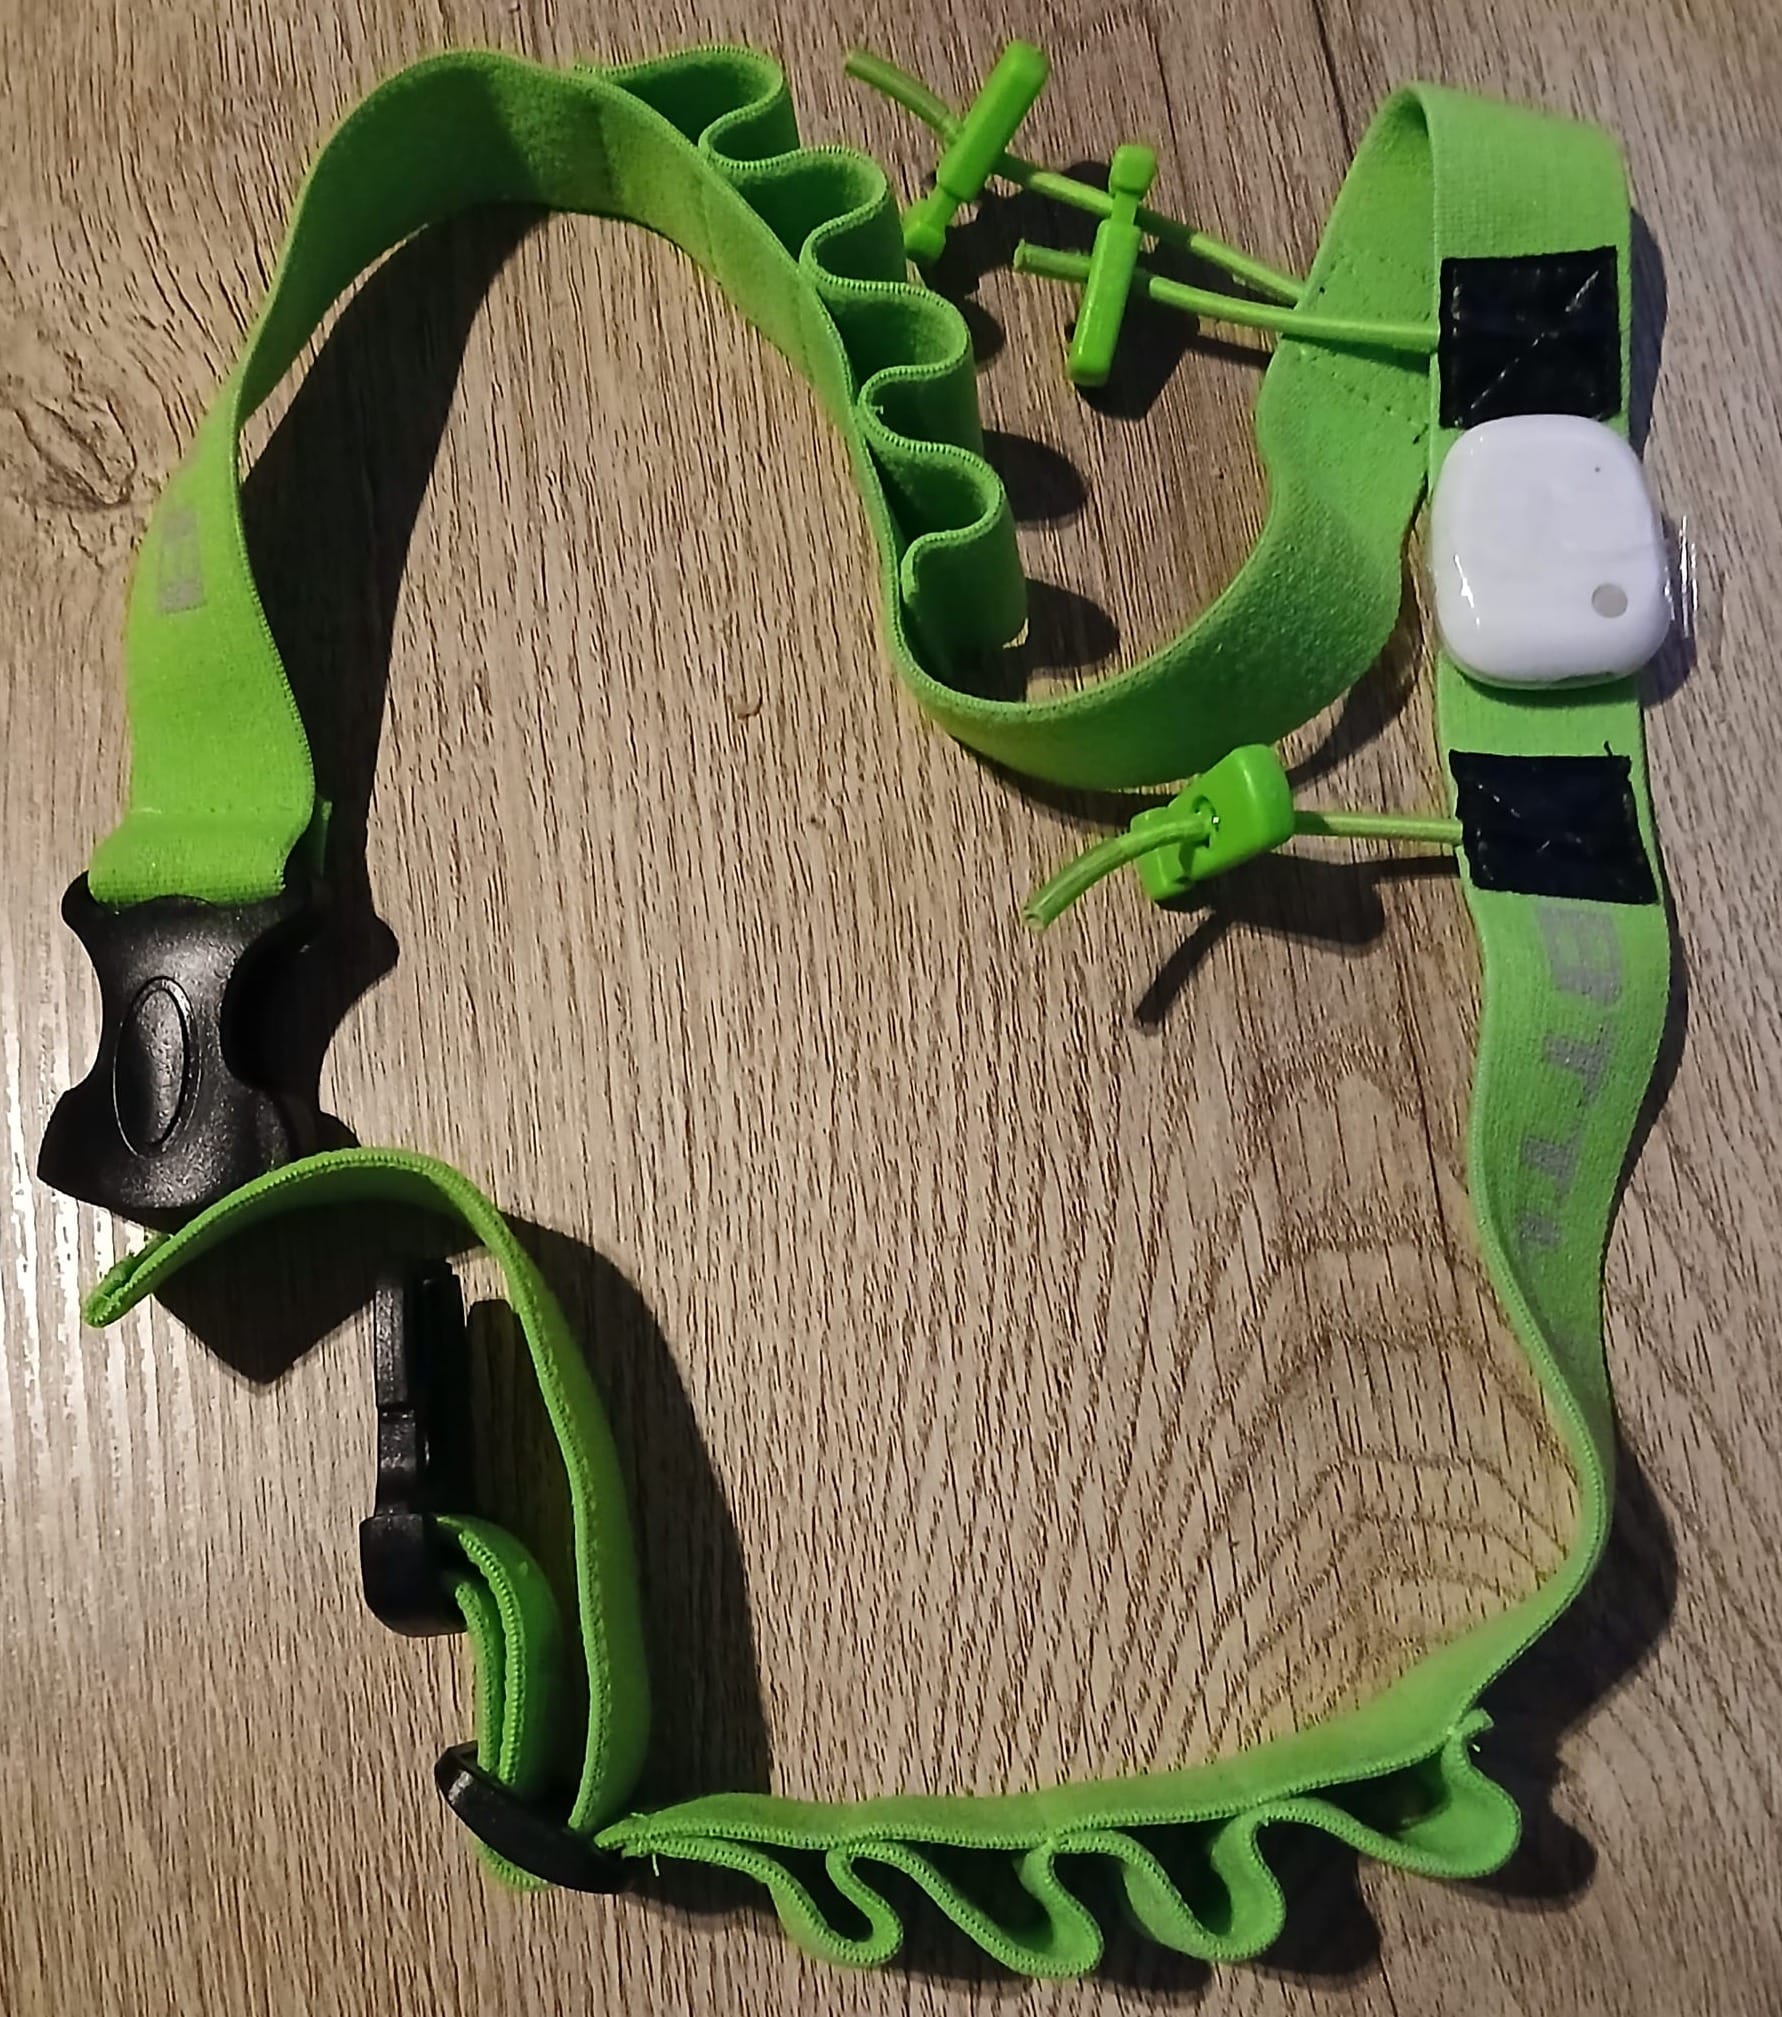
The sensor mount is a bit of a hack: a runner band with the sensor taped on. It’s crude but works for now. It is also adjustable for different waist sizes, so, I can ask some of my cycling friends to try it as well.
Conclusion:
It was quite a bit of work to build the current setup. I plan to use it and check how the results are. During conversations with friends, some new ideas came up. For example, a friend recovering from hip surgery mentioned it could help track rehab progress. There's potential for gamification in rehab or even broader sports applications. With that in mind, I’m keeping the data acquisition system as general as possible.
The code for the project is available here -> https://github.com/niru-5/form-check